Hello!
The “iron law of supply and demand” is often described by means of a diagram which shows price being set at the intersection of supply and
demand curves. The picture below is copied from here.
Actually, I have always been rather confused about this, and I am in good company – the description at the “Investopedia” link above is muddled to say the least. In this post I would like to follow Steve Keens excellent analysis in his book “Debunking Economics”. The conclusions may come as something of a suprise!
Let us start by giving the usual explanation of this diagram. The story goes like this. The “demand” for a commodity is the number of units that are bought. In the diagram, the DEMAND curve shows the number of items of a commodity (say, pizza) that customers are willing to buy at
a particular price (in the schematic picture above, the ‘curve’ is a shown as a straight line, but this is an unimportant detail). The
demand curve falls from left to right – the thinking is that people will buy more of something if it is cheaper, so as price falls, demand
rises and as price rises, demand falls. This is the “Law of Demand”. The SUPPLY curve shows the amount of commodity that firms will supply
at a given price in order to maximise their profits, given their costs. The supply curve rises from left to right. The assumption is that
the 1000th pizza costs more to produce than the first – perhaps you have to pay overtime. At the point where the supply curve and the demand
curve intersect, firms can sell all their product, and at the price that maximises their profit at that level of demand, and since this
suits everybody, the price will settle at this point.
I have skimmed over the details because – it is all bunk.
Some critics point out that the “Law of Demand” is not a law at all. In many cases, people will buy LESS of something if the price falls.
For example, suppose you like coffee, but can only afford a small amount of ground coffee – most of the coffee you buy is instant. Now
suppose the price of instant coffee falls. You go in to the shop, buy your usual proportion of instant and ground coffee – and have some
change left over! So you decide to go back into the shop and swap some of your instant coffee for the more expensive ground coffee that you
prefer. The result is that when the price of instant coffee falls – you buy less of it. Instant coffee is a GIFFEN good. Now, as your income
gets bigger and bigger, you stop buying instant completely, and start occasionally buying even more expensive ready made coffee in a coffee
shop. As the price of ground coffee falls, you buy less ground coffee just as before, you bought less instant coffee. Depending on your
income level, any good can be a Giffen good.
Other critics point out that economists assume that consumers and producers are different, whereas in fact they are the same people. If the
price of instant coffee falls, the people who make instant coffee will have a wage cut – so they will buy less instant coffee. Still others
point out that different consumers have different levels of income, and this will affect the choices they make, which has serious
inmplications for the demand curve, touched on below. Amusingly, early theorists got around this problem by supposing that a benevolent
authority continually redistributes income in an optimal way, leading to the result that capitalist theory only applies under a communist
dictatorship.
To get around these objections, economists assume that GIFFEN goods are rare; that all consumers have exactly the sames tastes; and that everyone spends the same proportion of their income on Pizza, so that if someone with an income of £10,000 a year eats one pizza a week, someone with an income of £10,000,000 p.a. will eat 10,000 pizzas a week. This amounts to the claim that there is in effect only one giant consumer, who has a huge income, and who spends it in exactly the same proportion as all their identical component consumers. Without all these assumptions, for a real polulation the aggregate demand curve for all consumers does not fall smoothly, but wriggles around all over the place – like a snake in a hurry, as Keene puts it – so there may be may different prices that intersect the supply curve, and the argument that price is set by supply and demand makes no sense.
Finally, reputable sources point out that the diagram only applies under assumptions that economists call “perfect competition”, described
in Wikipedia . The reader is invited to follow this link to check the plausibility of the necessary conditions.
The assumptions under which the diagram above can be drawn at all are sufficiently counterintuitive as to justify a raised eyebrow. But
Keene points out that there is a further assumption implicit in this diagram which is not just far fetched but impossible because it
amounts to the claim that 0 + 0 = 1. The best way to understand this is to start by considering the case of a monopoly.
In the diagram below, the demand curve is the same as before. But the supply curve has been replaced by two different lines, labelled
“marginal cost” and “marginal revenue”. Don’t be put off by the jargon – the idea is simple. Marginal cost is the extra money the company
must spend to make one more pizza. This includes the flour and mozzerella, as well as labour costs and rental costs. Marginal revenue is the extra money the company gets by selling one more pizza. Here is the thing – this is NOT simply the price they are paid for the pizza,
because to sell the extra pizza they have to drop the price of ALL pizzas. For example suppose they can sell 100 pizzas for £5 pounds, and
they can sell 101 pizzas for £4.99. The extra money they make from selling the extra pizza is (101 * 4.99) – (100 * 5) = £3.99. So by selling an extra pizza and dropping the price they make an extra £3.99, and not £4.99, the price of the pizza. This means that the marginal revenue curve is always below the demand curve, because the new price is applied to all the pizzas, not just the last one.
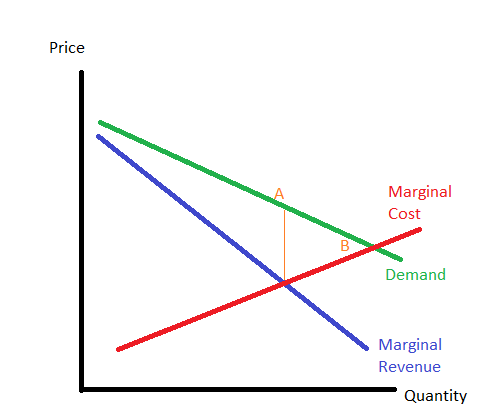
It is easy to see that to maximise profits, the firm should keep make pizzas until the marginal cost = marginal revenue (the point where
these lines intersect). Below this point they can make more money by selling extra pizzas; above this point, they will make less money each
time they make another pizza, because extra costs outweigh extra income. Having decided how many pizzas to make, the price they can fetch
for each pizza is given by point A on the demand curve. We can see that the monopoly makes fewer pizzas and sells them for a higher price
than suggested by the first diagram, represented here by point B.
So why the difference? The first diagram assumes “perfect competition” in which lots of different pizza companies compete in the same
market. What difference does this make? Well intuitively, if a second company enters the market everything changes. Each company has half
the market; the fixed costs will be increased, so fewer pizzas can be made at a profit; then one company tries to take market share by
dropping the price and selling more pizza into the same demand curve. I have not got the time or the mathematical sophistication to follow
this argument and I don’t know where it leads – but thats OK, because that is not the way the argument goes! Instead, economists make a
bizarre and nonsensical argument. First they say that because each firm is small, it cannot affect the market price, so a company can make
at extra pizza without dropping the cost. In the example above, our company sells the extra pizza for £5 and the extra money they make is –
£5. In this case, the “marginal revenue” is exactly the price they get for the new pizza, and the “marginal cost” curve and the “demand
curve” coincide, which brings us back to the original diagram.
But here is the thing; they say that a single company making an extra pizza makes no difference to the price, but at the same time, they say that if the market as a whole makes an extra pizza, the price drops, as shown by the demand curve. This is just flat nonsense. Keene shows that if this error is corrected, the most profitable thing for each firm to do is produce pizzas in such a way that the whole market is exactly the same as it would be for a monopoly. Of course the whole argument is false; to know how breaking the monopoly affects price and demand, you would have to do the analysis I chickened out of earlier.
To summarise, the supply and demand diagram does not exist as shown, and if it did, the price would not be as claimed. Price is not determined by the instersection of supply and demand curves; the story of supply and demand is bunk.
———————————————–
The interesting question here is, why has a generation of economists expended so much effort on a mistaken picture of supply and demand? I
think the reason is simple; the current generation of economists did not look at the world and seek theories to explain it; instead, they
decided a theoretical result that they wished to prove, and then found conditions under which this proof could be made, regardless of their
truth in the real world. Initially the conditions were fanciful; then absurd; and ultimately flatly impossible. The search for this proof
is reminiscent of the quest to turn lead into gold, or the quest for the holy grail, and is equally chimerical.
What is the result that they wished to prove? They wished to prove that the free market, without any constraints, would naturally lead to a
situation in which everyones welfare was maximised. The motivation for this is to try to prove the claim made ever since the days of Adam Smith that individual greed and selfishness lead inevitably to the greatest public good. The result is similar to the religious claim that because God all all powerful and all good, this must be the best possible wold, despite appearance. Economists believe that because the Market is all powerful and all good, the resulting economy must be the best possible economy regardless of the poverty and suffering that it produces. The quest is foolish; it is completely obvious that selfishness cannot possibly lead to the greatest good; if proof is needed, the Tragedy Of the Commons is sufficient. More on this next time.